Commercial Real Estate Index
Strong economic and job growth, as well as the demand for industrial space driven by e-commerce retail, provided the support for a stronger industrial and office market in the first quarter of 2019. SIOR members indicate that industrial and office property development, acquisitions, and leasing activity were broadly stronger during the first quarter compared to both one year ago and historical averages. However, vacancy rates and asking rents appear to be easing given the strong pace of development activity. We discuss these trends in this issue.
MACROECONOMIC ENVIRONMENT
Now on its 11th year of expansion, the economy continued to expand at a strong pace of 3.2 percent in 2019 Q1 (advance estimate), up from 2.2 percent in 2018 Q4. The uptick in growth came on the back of the stronger pace of expansion in exports (3.7 percent), gross private domestic investment (5.1 percent), and government spending (2.4 percent).
Gross private domestic investment rose at a faster pace due to the significant bump in non-farm inventories. Non-residential investment expanded at a more modest pace (2.7 percent) compared to the pace in the previous quarter as investment in structures contracted (third straight month), while investment spending for equipment (0.2 percent) barely increased. Intellectual property products investment rose strongly (8.6 percent), although a bit slower than the double-digit growth in the past quarter. Residential investment spending was the only sector that did not contribute for the third straight quarter (-2.8 percent). Rising interest rates and the Fed’s announcement of more rate hikes in 2018—which changed to a ‘patient’ policy stance in December 2018—may have contributed to the slowdown in non-residential investment spending. The U.S. - China tariff wars, which escalated during the second half of 2018, may have also impacted investment spending.

Consumer spending increased although at a subdued pace (1.2 percent) compared to past quarters in 2018. Consumer spending accounts for about two-thirds of GDP, so the slowdown raises a red flag about the continued strength of the economic expansion moving forward. While consumers did spend less on durable goods (motor vehicles, household furnishings, and other durable goods), spending for non-durable goods and consumer services increased (housing and utilities, healthcare, transportation, and financial services and insurance). Solid job and wage growth continue to provide support for sustained consumer spending for now.
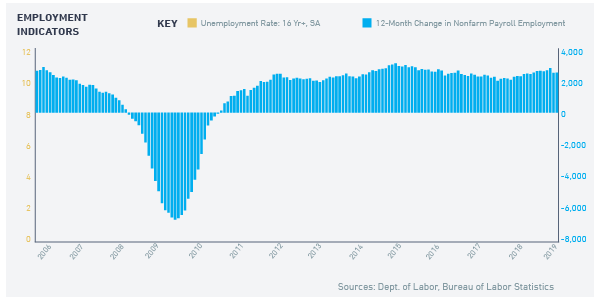
In the past 12 months, the economy generated 2.5 million jobs, sustaining the average of 2.3 million net new jobs created annually since September 2011. The unemployment rate continued to trend south, to 3.8 percent as of March 2019. Job openings outpaced the number of unemployed as of February 2019, with 6.4 million job openings compared to 6.2 million unemployed workers. With unemployment trending down, wages have been rising in real terms, with the weekly average wage increasing by 3.2 percent year-over-year, while prices were rising at a slower pace of 1.9 percent.
Industries that use office and industrial space generated strong employment in the past 12 months, except for information services. Education and health jobs, and professional and business service jobs increased by about half a million jobs each. Transportation and warehousing generated 165,000 jobs, which offset the loss in retail trade lost jobs (-47,400). Transportation and warehousing are the backbone of the logistics for e-commerce retail sales. E-commerce has grown phenomenally since 2000, with sales valued at $513 billion in February 2019, accounting for 10 percent of retail sales, up from a mere 1 percent in 2001.
SIOR INDEX RESULTS
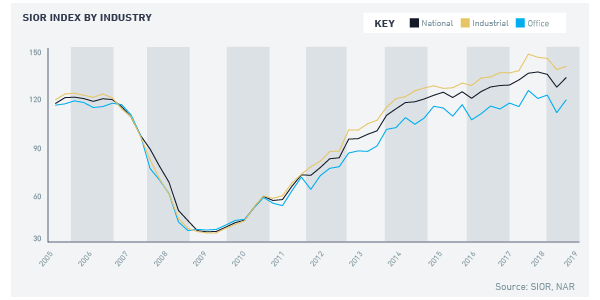
Amid stronger first quarter growth, the SIOR CRE Index1 turned around in the first quarter of 2019 to 126.3, after dipping in the fourth quarter of 2018. Both industrial and commercial indices increased: the SIOR CRE Index-Industrial rose to 138.9 while the SIOR CRE Index-Office notched up to 118.3.

The industrial property market continues to perform better than the office property market (indicated by the higher value of the SIOR CRE Index-Industrial), bolstered by the continuing expansion of e-commerce retail sales that is driving the demand for industrial space for warehousing, packaging, and distribution.
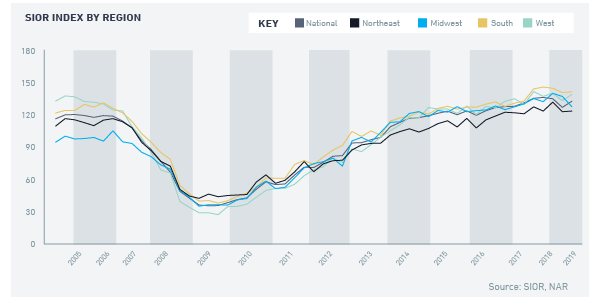
Regionally, industrial and office activity is strongest in the South (140.7) and the West (138.3) followed by the Midwest (126.9) and the Northeast (122.9). The index increased on a year-over-year basis except in the Midwest.
The survey asks respondents about 10 market conditions pertaining to development, acquisitions, leasing, and economic conditions. Survey responses indicates that the industrial and office markets remain characterized by robust site acquisition, strong price growth, and vacancy rates that are easing somewhat. Respondents perceived local and national economic conditions as positive for business, although the fraction is lower compared to one year ago, indicating that respondents are anticipating more challenging economic times ahead.
- Leasing activity exceeded historical levels in 2019 Q1 for 65 percent of SIORs who responded to the market survey (51 percent in the prior quarter; 63 percent one year ago).
- Vacancy conditions are easing, with 50 percent of SIOR respondents reporting fewer vacancies compared to one year ago, a smaller fraction compared to the previous quarter and one quarter ago (53 percent in the prior quarter; 61 percent one year ago).
- Asking rents moderated compared to one year ago—only 35 percent of SIOR respondents reported that asking rents were above historical trends (73 percent in the prior quarter; 78 percent one year ago).
- Subleasing availability is still tight compared to normal volume of sublet space, with five percent of SIOR respondents feeling that there was ample sublease space in their markets (seven percent in the prior quarter; five percent one year ago).
- Tenant concessions remained skewed in favor of landlords compared to normal negotiating conditions, according to 57 percent of respondents (57 percent in the prior quarter and one year ago).
- New construction of office and industrial spaces is generally above historical average, according to 63 percent of SIOR respondents (52 percent in the prior quarter; 55 percent one year ago). However, development is non-existent in some markets, with eight percent of respondents reporting no new construction in their area, a smaller fraction compared to past quarters (17 percent in the prior quarter; 14 percent one year ago).
- Site acquisition conditions remain favorable for sellers, according to 67 percent of SIOR respondents(68 percent in the prior quarter; 70 percent one year ago).
- Investment pricing conditions are above replacement cost of the property, making it profitable for sellers, according to 49 percent of SIOR respondents (42 percent in the prior quarter; 44 percent one year ago).
- Local economic conditions are strong and accelerating, according to 69 percent of SIOR respondents. The fraction is higher from the level in the past quarter (61 percent), but it is a significant decline in the share from one year ago (73 percent). This indicates that although the current local economies are still strong, respondents anticipate economic headwinds ahead.
- National economic conditions were a positive influence on the business, according to 63 percent of SIOR respondents, an increase compared to the past quarter (59 percent), but also a significant decline in the share from one year ago (74 percent), an indication that SIOR respondents were anticipating more challenging times in the next months. Fifty-three percent expect an improvement in market conditions in the next quarter, a lower fraction from one year ago (64 percent).
PROPERTY PRICE, VOLUME, AND CAP RATE TRENDSIndustrial and office property prices are still rising but at a decelerating pace, according to data from Real Capital Analytics. Industrial property prices rose 8 percent in the first quarter of 2019 from one year ago. Office property prices rose at more subdued pace of 5.2 percent. From the low point in 2010, industrial property prices have increased 82 percent while office property prices are similarly up by 80 percent.
The volume of industrial property transactions was up by 6.4 percent from one year ago, while the volume of office property transactions was up 6.6 percent, a strong pace of growth for both although tempered compared to past years: from 2009 through 2010—2011, industrial and office transactions expanded at a stronger pace of about eight percent.

Cap rates for industrial and office property assets are about the same, at 6.4 and 6.6 percent respectively. The multi-family property asset class has the lowest cap rate , at 5.4 percent, given the strong demand for housing and the lack of supply for both owner-occupied homes and rentals.
In summary, sustained economic expansion and the sharp rise in e-commerce sales continue to bolster the demand for industrial and office properties.
1-The index is based on 10 variables pertinent to the performance of U.S. industrial and office markets: leasing activity, asking rents, vacancy, subleasing conditions, tenant concession, development conditions, site acquisitions conditions, investment pricing conditions, local economic conditions, and U.S. economic conditions. An index value of 100 shows a balanced market, while an index above 100 indicates growing conditions, having surpassed its historical average.