Commercial Real Estate Index
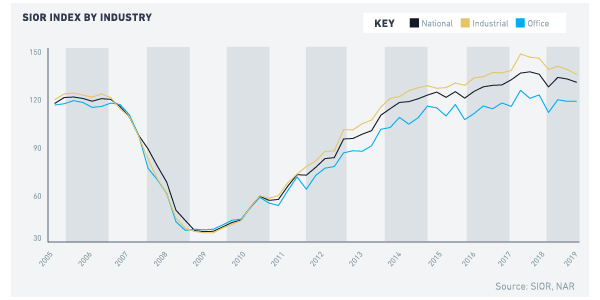
Industrial and office commercial activity and market conditions continued to weaken in 2019 Q3 compared to the prior quarter, according to members of the Society of Industrial and Office REALTORS® (SIOR) who responded to the 2019 Q3 survey1. The SIOR Commercial Real Estate Index—an index that is based on 10 indicators of development activity, sales/acquisitions, and leasing—decreased 0.9% to 128.7 from the prior quarter’s level. To note, the index is still above 100, which means that the industrial and office property markets are still broadly “strong."

Both industrial and office indices decreased compared to the past quarter and year-ago levels: the SIOR CRE Index-Industrial decreased to 134.4 (137.1 in 2019 Q2) and the SIOR CRE Index-Office declined to 116.5 (117.2 in 2019 Q2). However, both indices are still above 100, indicating the industrial and office markets’ strength. The SIOR CRE Index-Industrial continues to move above the industrial SIOR CRE Index-Office. The demand for industrial office space has been propelled by strong e-commerce sales that relies on an efficient logistics network of warehousing, distribution, and last-mile delivery services. Valued at $641 billion, electronic and mail-order sales now account for nearly 11% of retail sales, up from just 3% in 2000. Meanwhile, continued solid employment growth continues to buoy the demand for office space, with the economy continuing to generate at least 2 million jobs annually.

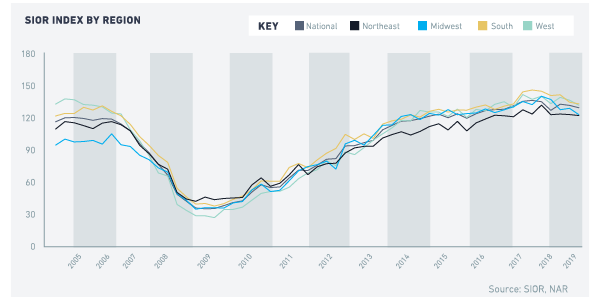
Respondents reported a decline in industrial and office activity across all regions in the third quarter compared to the prior quarter, although all regional indices are above 100. The strongest market is the South region (132.3), followed by the West (131), the Midwest (122.3) and the Northeast (121.5).

Respondents reported some moderation in leasing and development activity. The decline in the index is in line with the broad contraction in investment spending (-6.3%) and exports (-5.7%) that occurred in the second quarter of 2019 as the U.S.-China tariff war increased the cost of imports, reduced export demand from China, and caused increasing economic risks to not just growth in the United States but globally. Orders of manufactured durable goods, an indicator of business confidence, have fallen since the third quarter of 2018.
Based on the 10 components that make up the index, the decrease can be attributed to slower leasing and development activity, slightly higher vacancy rates, and a worsening of economic conditions. However, a higher fraction of respondents reported rising rents and acquisition costs, indicating that commercial prices continue to hold up (Box 1).
| Box 1: Industrial and Office Market Conditions in 2019 Third Quarter - A higher fraction of respondents reported that leasing activity was below historical levels in 2019 Q3, at 15% (13% in the prior quarter).
- A higher fraction of respondents reported an increase in asking rents from one year ago, at 82% (78% in the prior quarter).
- A higher fraction of respondents reported that vacancy conditions eased in 2019 Q3 compared to one year ago, at 13% (15% in the prior quarter).
- A lower fraction of respondents reported tight subleasing availability compared to normal volume of sublet space, at 66% (70% in the prior quarter).
- A lower fraction of respondents reported tenant concessions favored landlords compared to normal negotiating conditions, at 51% (56% in the prior quarter).
- A smaller fraction of respondents reported that development activity is above historical level, at 50% (57% in the prior quarter).
- A smaller fraction of respondents reported rising site acquisition costs, at 58% (71% in the prior quarter).
- A higher fraction of respondents reported that investment pricing conditions are above replacement cost (profitable to build), at 46% (42% in the prior quarter).
- A smaller fraction of respondents reported local economic conditions are improving, at 67% (71% in the prior quarter).
- A smaller fraction of respondents viewed national economic conditions as having a positive influence on business, at 60% (63% in the prior quarter).
|