Commercial Real Estate Index
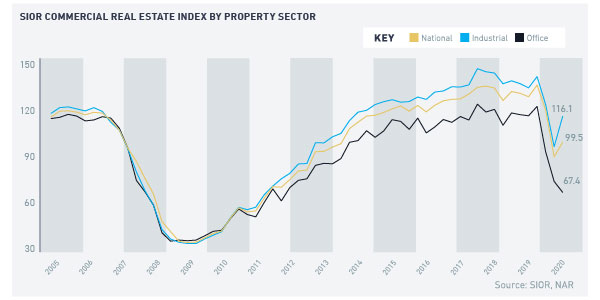
The SIOR® Commercial Real Estate Index—a barometer of industrial and office property market conditions —shows that the office sector continues to reel from the economic fallout of the Coronavirus pandemic, while the industrial sector continues to be the bright spot of the depressed commercial market. The index is based on 10 indicators pertaining to sales/acquisitions, leasing, construction activity, and economic conditions.
The SIOR® index that reflects third quarter transactions rose to 99.5 on the back of an uptick in the industrial index, which offset the decline in the office index. The SIOR index rose 9% quarter-on-quarter as the industrial index rose by 19% while the office index fell by 7%.
Compared to the peak in 2019 Q4, the SIOR index has fallen by 27%, weighed down by the 45% decline in the office index and the 18% decline in the industrial index.
The regional indices continued to decline for the Northeast (-9%), South (-2%), and West (-4%) regions while the Midwest regional index showed an uptick (2%).
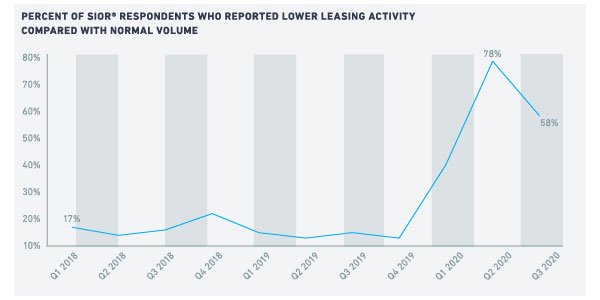
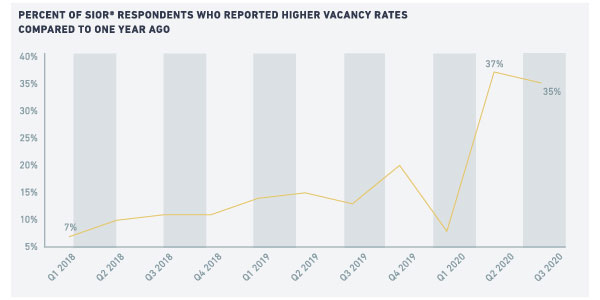
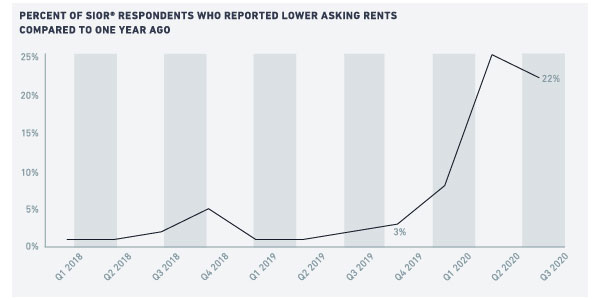
Nearly 60% of respondents reported weaker leasing conditions compared to their normal volume of transactions. Slightly more than a third of respondents reported higher vacancy rates compared to one year ago. Nearly a fifth reported a decline in asking rents, and about 40% reported deep discounts for tenants. While these are lower percentages compared to the second quarter, these rates remain elevated compared to pre-pandemic levels.

DEMAND FOR OFFICE SPACE LIKELY TO RETURN TO NEAR NORMAL BY 2022 Q2Since May and through September, the office-using industries—information services, financial activities, (composed of finance and insurance; real estate, rental, and leasing), and professional and business services and—have recovered 1.04 million payroll jobs.1 However, 1.8 million jobs are still to be recovered. At a rate of 100,000 jobs created monthly, it will take 18 months to recover the lost jobs, which means a full recovery by March 2022 (for comparison, 153,000 jobs were created in September).
Working from home is the game-changer of the office sector’s long-term outlook. The fraction of workers who telework continues to decline, but it remains elevated compared to pre-pandemic level (6% among all workers).2 How the new normal will settle is still evolving, but the share will likely be higher if working from home becomes part of the package of employee incentives.
| Industrial and Office Market Conditions in 2020 Third Quarter - 58% of respondents reported that leasing activity was lower than the historical volume (78% in the prior quarter).
- 22% of respondents reported a decrease in asking rents from one year ago in their markets (25% in the prior quarter).
- 35% of respondents reported tighter vacancy conditions compared to one year ago (37% in the prior quarter).
- 36% of respondents reported a glut in subleasing availability compared to normal volume of sublet space (27% in the prior quarter).
- 40% of respondents reported deep discounts for tenants (48% in the prior quarter).
- 36% of respondents reported development activity is below historical level (45% in the prior quarter).
- 24% of respondents reported site acquisition costs are falling (21% in the prior quarter).
- 31% of respondents reported investment pricing conditions are below replacement cost and that it was profitable to build (42% in the prior quarter).
- 31% of respondents reported weaker local economic conditions (42% in the prior quarter).
- 43% of respondents viewed national economic conditions as having a negative effect on (20% in the prior quarter).
- 81% of respondents expect the economy to have a negative effect on their market in the upcoming quarter (82% in the prior quarter).
|


The demand for subleased spaces—generally associated with hot/open desks or co-working—has fallen, as workers work from home and practice social distancing. The metro areas that have been most impacted are areas associated with tech workers—such as Rochester, San Francisco, New York, Austin, Salt Lake City, Phoenix, Charlotte, Seattle, Nashville, Inland Empire, and Portland.3
The demand for sublease space will face headwinds as a large fraction of tech workers—the main users of subleased space—continue to work from home. Still there will continue to be a demand for sublease space from office occupiers seeking short-term leases, especially from start-up businesses that face a higher risk of failure in the early years of the business.

E-COMMERCE SALES CONTINUING TO SUPPORT DEMAND FOR INDUSTRIAL SPACEThe industrial property market is the bright spot in a distressed commercial market. The strength of the industrial properties market is evident in the strong employment growth in warehousing and storage. As of September, there were 37,000 more workers in this industry compared to the level in March, bucking the overall trend where the level of employment is still nearly 11 million below the pre-pandemic level.
Retail sales (seasonally adjusted) contracted by as much as 13% month-over-month in April. However, sales quickly recovered in May, and were up 2% month-over-month as of September.4
The demand for industrial properties has been driven by the acceleration of online shopping with consumers still hesitant to take a trip to the shopping center or malls. As of September, the annual dollar volume of electronic shopping and mail order sales rose to $778 billion, accounting for 14.3% of retail sales (excluding food services).
Despite the sector’s strong fundamentals, investors retreated on their acquisitions of industrial properties in August (-62% year-over-year), but this is still a smaller decline compared to acquisitions of office properties (-73%), retail (-73%), and multifamily (-65%), according to Real Capital Analytics.
The commercial real estate industry continues to reel from the pandemic’s effects, and the headwinds have even become stronger with the resurgence of coronavirus cases in winter. We will continue to see an unbalanced recovery, with the industrial property sector outperforming the office sector and certainly, retail and lodging.
1-Source: US Bureau of Labor Statistics
2-Source: US Census Bureau, US Bureau of Labor Statistics
3-Source: Cushman and Wakefield
4-Source: US Census Bureau